
By Cliff Holste, February 12, 2014, SCdigest.com
‘A Picture Is Worth a Thousand Words’
The inbound side of a typical Distribution Center can receive 100s or perhaps 1000s of different products every day. On the outbound side 100s or 1000s of customer orders are filled and shipped daily. The operations that take place between inbound and outbound are multifaceted and unique to the storage and order fulfillment strategy of that DC. Without a diagram, picture, or graphic of some kind it can be difficult to visualize how all of the functional pieces fit together and operate as a single unit.
The old adage ‘A picture is worth a thousand words’ refers to the notion that a complex idea can be conveyed with just a single still image. It also aptly characterizes one of the main goals of visualization, namely making it possible to absorb large amounts of information quickly.
From an operational perspective, flow charting allows DC managers, system planners and developers to breakdown the overall DC operation into individual processes. By displaying these processes in graphic form, it becomes easier to analyze the relationship between them. In addition, flow charts are useful for many other practical purposes, such as:
- a visualization design tool and springboard for further discussion/analysis of product and information flow through the system network,
- to identify points where customer order fulfillment data can be usefully collected and analyzed,
- to identify potential bottlenecks and heavy activity/traffic areas,
- to better understand integrated system operations and flow,
- a prerequisite to constructing a computerized simulation model.
Exposing Problem Areas
If current DC operations are suspected of underperforming, creating an up-to-date flow chart would be a practical and inexpensive first step before commissioning an operational assessment. There is no better tool for managers and system planners to drill down into the minutiae of detail to uncover systemic problems. Over time changes are often made as a quick band-aid approach to problem solving. While the impact of any one of these changes may be minuscule, the accumulated effect over time can impact system operations in unexpected ways.
There are many easy to use, out-of-the-box PC programs available for constructing flow charts. Note: go to Google – Flow Chart Maker. The one illustrated below was done in Microsoft Office Visio.
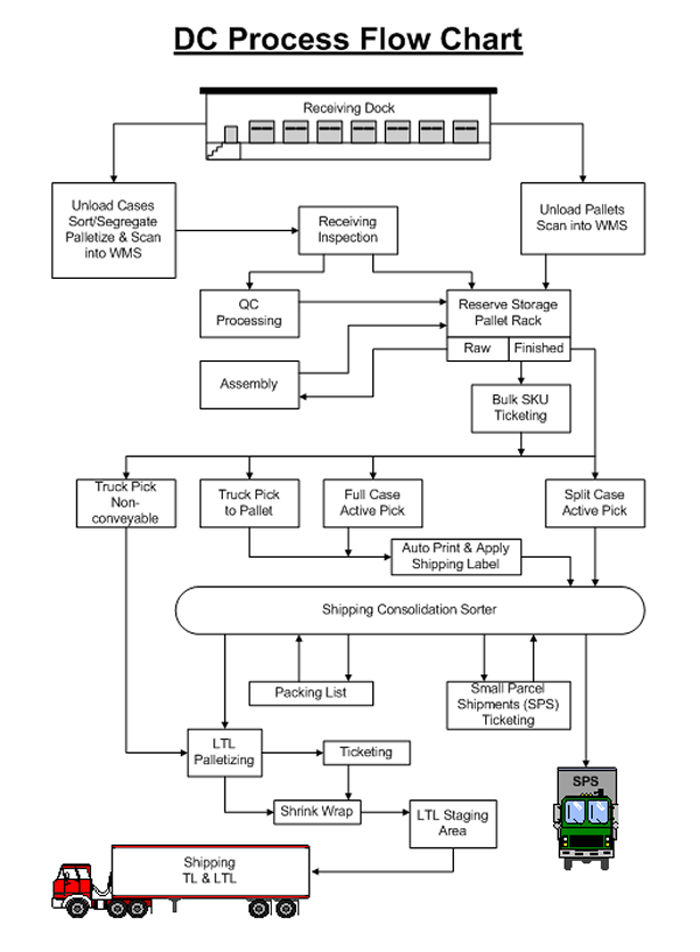
Constructing a DC process flow chart for the first time can be a bit perplexing. Getting the current flow diagramed correctly is critical to uncovering potential pathways for improvement. Because there are several individuals that have input, it may be best to start diagramming the flow on a black board for all to see, which makes it easier to erase and change as you move along. Once you have identified all of the principal processes between receiving and shipping (as shown in the above example), you can construct the first computer version and print copies for each person to study.
Although it is not strictly necessary to use a commercially available flow charting program, it does facilitate working with others. With many of these programs, double clicking on a symbol opens up a data box containing important metrics. Going forward service providers such as independent consultants and system planners will have an excellent tool and data base to begin their more in-depth analysis.
Final Thoughts
In the end it may be that the most important benefit of flow charting your operation is the exercise itself. It forces you to step back and visualize the total DC system operation. It promotes close examination and discussion of each department within the DC and how individual operations relate to upstream and downstream functions. In so doing you are bound to uncover new opportunities for improving overall DC performance.