13th Annual Advancing S&OP to Integrated Business Planning – Amsterdam February 2017

Date: 8 – 10 February 2017

Location: Amsterdam | Radisson BLU

Register here

“Set your ambitions high and transform your organisation to achieve IBP that can actually drive profit and overall growth”

This three-day conference is a flagship event for professionals involved in the S&OP process. If in the past, we were focusing on more basic elements of the S&OP process, companies are now facing a key challenge in moving forward their S&OP to Integrated Business Planning seen as a transformational process throughout the organization. As such, we will explore how to embed S&OP in a matrix and multi-country environment, how to translate volume-based S&OP to value-based S&OP, and how to bring concrete profit and growth gains.

The ultimate aim is to design IBP as an enterprise-wide, transformational process. With that ideal in mind, we will look at the practical challenges companies are facing at the different stages they find themselves in the S&OP to IBP journey. We will discuss how to take IBP beyond the sales and operations phase into financial analysis and controlling, how to put the aggregated  numbers together, and move away from silos, as well as investigate the behavioural considerations behind realistic forecasting. This marcus evans event provides the best platform for benchmarking and moving forward your S&OP efforts, with interactive discussions and practical case studies from top companies in Europe.

The key topics of this year’s summit will be:

  • S&OP: A Volume Planning Exercise or Something More?;
  • Change Management: How to Handle it Well in your IBP Implementation Efforts;
  • How to Embed IBP in a Matrix and Multi-Country Environment;
  • Designing IBP as an Enterprise-Wide Transformational Process;
  • How to Use Big Data in the S&OP Process for More Accurate Forecasting Models.


MORE INFO

Can Intermodal Become a Preferred Destination for Europe’s Freight Industry?

BY OUR CONTRIBUTING PARTNER ZARAGOZA LOGISTICS CENTER (ZLC) 

The European Union’s (EU) rich mix of cultures and working practices is one of its strengths. But in intermodal transportation these differences can impede future growth. One of the main goals of an EU-backed project called SMART-RAIL is to remove attitudinal and other barriers that prevent more freight from switching to intermodal in Europe.

SMART-RAIL involves 19 organizations and aims to improve European freight logistics services by meeting customer needs in five critical areas: reliability, flexibility, lead time, cost, and visibility. Promoting the use of intermodal services is a key element of this overarching goal.

After declining in 2009 owing to the global financial crisis, intermodal cargo volumes in Europe have grown steadily and reached 20.8 million twenty foot equivalent units or TEUs in 2013. Today, intermodal is expected to maintain an average annual growth rate of about four percent.

Road remains the predominant mode of transportation in intermodal moves, but rail is catching up. In fact, rail intermodal freight is growing faster than pure rail transportation in the EU. Rail has a much smaller carbon footprint than road, but lacks the flexibility of truck transportation. Combining the two – and adding barge transportation where possible – meets sustainability goals for freight networks while offering the operational flexibility that shippers need.

But first, shippers, carriers, and third-party logistics providers (3PLs) in Europe have to be willing to consider intermodal when planning the movement of freight. All too often this option is ignored by these stakeholders – even when products are suited to multimodal transportation and the requisite services are available.

“One of the problems is a lack of awareness about logistics networks in other European countries,” says Susana Val, Associate Research Professor, Transport Research Manager, Zaragoza Logistics Center (ZLC), Zaragoza, Spain. ZLC is leading the supply chain management work package in the SMART-RAIL project.

Stakeholders in, say, Spain, might have little knowledge of the freight needs of stakeholders in, say, Germany, and vice-versa. “This makes the sharing of information very difficult,” she says. Securing backhaul cargoes – an important element of efficient intermodal networks – is extremely difficult when trading partners operate independently in this fashion.

Different national regulations and equipment specs also separate freight interests across the EU. In addition, there is often little awareness of how logistics decisions in one part of a freight network can impact operations in another part, especially where cross-border moves are involved. The lack of end-to-end visibility masks how disruptions ripple through supply chains.

Stakeholders’ tunnel vision is compounded by a silo mentality. “The parties are often not willing to relinquish control of their part of the supply chain,” says Val. “For example, carriers might regard other transportation modes as competitors and be unwilling to share information.”

Yet efficient intermodal transportation relies on the close integration of component modes.

The SMART-RAIL team led by ZLC is looking at ways to overcome these barriers and support the growth of intermodal cargo volumes. Optimizing the use of intermodal networks is called synchromodality.

“We are exploring opportunities for intermodal services and ways to build cooperation across these networks. By establishing common goals and approaches, we can build a powerful business case for intermodal,” Val explains.

One of the mechanisms for breaking down perceptual and operational walls is a Control Tower (CT). The team is developing a CT with 3PL Seacon Logistics. Seacon divisions in the Netherlands and Italy are part of the project consortium.

The CT functions as a real-time information hub that brings trading partners together and improves the monitoring of freight flows. Achieving better supply chain visibility also “gives us insights into disruptions that we can use to plan mitigating actions such as re-routing shipments when necessary,” Val says.

The researchers have generated a preliminary list of key performance indicators (KPIs) that are part of the CT design, and also relate directly to the concept of synchromodality.

These KPIs are:

  • Pickup performance.
  • Delivery performance.
  • Lead time.
  • Transit time.
  • On-time departure/arrival.
  • Un/loading performance.
  • Train service availability.
  • Visibility of the service.
  • Tracking and tracing.

The ZLC-led team is also working to raise awareness levels among groups of freight interests in EU countries. This effort includes disseminating information about freight networks – a database of stakeholders has been created – and intermodal opportunities, and promoting working relationships between potential trading partners.

SMART-RAIL is a three-year project that is scheduled to run until April 2018. The intermodal team is currently looking at the bottlenecks that impede freight flows. “We are also consulting with stakeholders to align them along common goals and create cooperative business models along the supply chain,” Val says.

As she emphasizes, improving intermodal transportation will deliver multiple benefits. There is huge potential for cutting transportation costs, improving the reliability and robustness of services, and shrinking the carbon footprint of logistics operations – a major goal in the region. New analytical capabilities will shed more light on how intermodal can be deployed in Europe.

There are intangible benefits too, notably greater collaboration between stakeholder groups across the EU, and a mindset that is much more amenable to developing new freight transportation solutions.

Delayed Payments Can Be a Win-Win for Buyers and Suppliers

BY OUR CONTRIBUTING PARTNER ZARAGOZA LOGISTICS CENTER (ZLC) 

Extending payment terms to 120 days or more frees up working capital for big companies, but it can also increase the financial stress on suppliers and ultimately lead to increased product costs. The tactic has attracted much criticism, but research underway at the Zaragoza Logistics Center (ZLC), Zaragoza, Spain, shows that delaying payments to creditors can actually be beneficial for both buyers and suppliers.

The number of large enterprises that have imposed more generous payment terms on suppliers has increased markedly over recent years. A recent article in the New York Times notes that European spirits company Diageo pays its bills in 90 days, and Modelez, Mars, and Kellogg, take 120 days to pay suppliers’ invoices. “The list of companies doing the same reads like a grocery store version of Who’s Who,” said the New York Times.

By paying suppliers much later than previously, big companies can unlock cash in their supply chains. In 2013 Procter & Gamble introduced a 75-day payment period for suppliers, and added an estimated $1 billion to the company’s cash flow, reported the New York Times.

But for many suppliers the tactic is a bitter pill to swallow, especially small and medium-sized enterprises (SMEs). These companies are particularly vulnerable to market volatility, and are often unable to find cheap external financing owing to the continued fallout from the 2008 global financial crisis.

It seems that SMEs have little choice but to make the best of an unfavorable situation – but there are better alternatives.

In 2010 Unilever extended its payment terms from 30 days to 90 days. Even though industry was still reeling from the aftermath of the 2008 meltdown, Unilever achieved an increase in total turnover of 25 percent, as well as 50 percent and 60 percent increases in operating profit and investments in fixed assets within a three-year time frame. Moreover, while there were rumblings of discontent when the change was announced, supplier protests were relatively muted.

The reason is that Unilever invested the funds freed up by its extended payment program in its supply chain. The efficiencies captured by Unilever were passed on to suppliers in the form of higher order volumes – in effect, a win-win.

The availability of supply chain finance instruments such as reverse factoring (RF) also made it possible for Unilever to extend payment terms without punishing suppliers.

RF is a vehicle for giving suppliers – especially SMEs – access to affordable financing. In a typical arrangement, a large company (the buyer) commits to paying invoices promptly to the factor (a bank) and the factor agrees to pay the supplier earlier than the due dates on its invoices to the buyer. The bank profits by charging fees for the service, the buyer benefits from the extended payment terms, and the supplier is able to get paid earlier and improve its cash flow position.

Most academic RF models show that when buyers associate their RF programs with terms extension, the value for their supply chain is lower than that achieved without the extension strategy. However, recent ZLC research shows that when the cost of raising funds – in the form of debt or equity – is high for buyers, extending payment terms can be economically efficient as long as the freed up cash is productively used, i.e., in plant and equipment investment.

There are many creative versions of RF financing. ZLC research shows that for SMEs the instrument improves operational performance, mitigates the impact of market volatility on cash flow, and offers the potential to unlock more than 10% of an enterprise’s working capital. The RF route also has some significant downsides. It is effective when the credit spread is large; when this is not the case suppliers are advised to look for other sources of financing. And, of course, RF services come at a cost for both the buyer and the supplier.

Therefore, when evaluating RF options suppliers should keep in mind that the direct benefits gained from improved service levels and profitability are not the only factors they need to consider. They should also assess how the capital freed up by these programs can be put to work in other ways.

The emergence of new variations on the RF theme, including open platforms that provide a wider choice of competing sources of finance, could change these tradeoffs. In addition, new fintech models such as blockchain have the potential to disrupt the RF market. The next phase of the ZLC research will look at these developments.

There is a growing need for insights into better ways to manage working capital. The recently released annual working capital survey by REL, a division of US consultants The Hackett Group, concludes: “Overall working capital performance continued to degrade, reaching poorest performance levels since the 2008 financial crisis.”  The survey looks at the performance of 1,000 of the largest public companies in the US during 2015.

Europe-Wide Roadmap Charts the Future of Transportation

BY OUR CONTRIBUTING PARTNER ZARAGOZA LOGISTICS CENTER (ZLC) 

Many socio-economic and environmental trends shape the evolution of freight and passenger transportation, especially within an enormous geographic region such as Europe. The European Union (EU) has launched a major project to build a roadmap of these trends up to 2030, that will ultimately be used to develop a toolkit for policymakers.

The Action Plan for the Future of Mobility in Europe (MOBILITY4EU) project kicked off at the beginning of this year and will run until the end of 2018. The Zaragoza Logistics Center (ZLC), Zaragoza, Spain, is managing the freight element of the project.

“We want to create a common vision for how European freight and passenger mobility will develop over the period and set a path for what should be achieved from a policy perspective,” says Carolina Ciprés, ZLC Director of Research Programs.

It’s a mammoth task. The project partners represent a wide cross section of interests. Numerous experts from various disciplines are helping the project team to sift through trends, and identify which ones are relevant and their likely impact.

The Multi-Actor, Multi-Criteria Analysis Method (MAMCA) for evaluating transportation projects is being used to assess the possibilities. MAMCA takes account of a broad range of factors including societal as well as economic outcomes. Multiple alternatives can be evaluated both qualitatively and quantitatively using the seven-step MAMCA method. The method is reinforced by a visualization-based process for mapping stories.

The first step is to define the problem and identify the alternatives. “We are being careful to distinguish between a goal and a trend,” says Ciprés. A goal might be achieving a certain reduction in carbon emissions, whereas a trend is developing transportation solutions that are environmentally sustainable. Other examples of trends include the growth in e-commerce, new wealth distribution models, the arrival of driverless vehicles, and the emergence of an uber-like economy. The team is currently honing the list of trends that pertains to the mobility of freight and passengers.

Having defined its areas of focus, the project will bring participating stakeholders into the picture. Including stakeholders in the evaluation process early on is an important step in the MAMCA methodology. The participants will identify the most likely scenarios based on the selected trends, and develop a common view of how the top-ranked scenarios will play out in the real world.

Implementation is the final step in the MAMCA process. The team will formulate an action plan for achieving the outcomes they have modeled. This plan will include a blueprint for the implementation of a sustainable and continuous European Transport and Mobility Forum after the project has been completed. An example of such a forum could be a new European Technology Platform for transportation.

Applying the action plan will also require the EU to translate it into policymaking tools that focus on specific interests such as pedestrians, environmental and industry groups, says Ciprés. “This huge roadmap will need to be filtered by need and/or sector.”

This type of project has not been attempted before in the EU, she says. Past efforts to formulate broad plans of action in transportation have tended to driven by a single mode such as road. “We are taking an overview and the modal impacts will come later, that is a key difference.”

The sheer number of experts from different countries that are supporting the project is also unusual, but necessary given the scope of the work. Moreover, this diversity of expertise brings many viewpoints and opportunities for fresh thinking.

Managing the vast body of knowledge is a challenge. “We have to develop a consensus view that is also neutral; a huge number of stakeholders are involved and the findings must be unbiased,” Ciprés says.

Optimization Tools Lighten the Load on Stressed Freight Networks

BY OUR CONTRIBUTING PARTNER ZARAGOZA LOGISTICS CENTER (ZLC)

Freight transportation networks are increasing in complexity at a time when companies are under immense pressure to improve service levels. Investing in more efficient infrastructure is one response to this challenge, especially in countries such as the United States where deteriorating transportation systems are struggling to keep up with rising traffic volumes. But there is another response to the problem: a new generation of powerful transportation planning solutions that optimize cargo flows across regional, national, and local networks.

The improved planning tools enable companies to cut transportation costs and drive up service standards. In addition, by increasing the utilization of existing road, rail, and water systems, these solutions can lessen the need for expensive investments in new infrastructure.

Rising demand

Maximizing the rate of on-time deliveries while keeping operating costs to a minimum has always been critical to the efficiency of freight transportation networks. However, meeting these targets has become even more important as markets demand lower prices and tighter delivery windows.

Global trends such as the rapid growth in e-commerce are driving these demands. The evolution of freight networks also is adding complexity to the movement of goods. For example, following the expansion of free trade zones and other open border initiatives, many distribution networks have been reconfigured to cut the number of distribution centers. These networks have become more reliant on long distance road transportation.

Distribution networks also have to cope with rising traffic volumes. For example, trade volume projections released earlier this year by the U.S. Department of Transportation show that freight tons moving on the country’s transportation network will grow 40% in the next three decades, and the value of the freight will almost double. Freight traffic in Europe is expected to follow a similar growth path.

Exacting task

More sophisticated transportation planning will not overcome these network challenges. But it is possible to increase the efficiency of freight networks by using more advanced planning tools to optimize goods flows.

It’s a complex task, that requires planners to manage units of transportation – whether they be rail cars, freight containers, or trucks – moving between multiple nodes. They must meet the needs of diverse shippers in a commercial environment that is subject to wide fluctuations in demand.

In general, freight transportation planning has lagged behind its passenger equivalent. Also, much freight planning work is done manually, making it difficult for planners to keep pace with the changes described above.

Consider, for example, a typical process for the distribution of empty rail cars. A rail operator receives orders from customers to transport specific volumes of commodities. Quotas of empty rail cars are often allocated on a daily basis. Next, a trip plan is generated that allows for the origin-destination pairs involved, as well as train timetables – usually drawn up annually –  and capacities. Cars are loaded in a station or a customer’s track facility, and finally moved to the required destinations for unloading.

Completing such a process – which can change any time in response to shifting customer demands – manually is unwieldly and costly. In fact, an analysis of such a process in the rail mode carried out by ZLC shows that these inefficient planning practices generate a significant volume of empty, and therefore non-productive, freight car space.

New Tools

More advanced planning tools that automate much of the planning process can eliminate such inefficiencies.

An example is the dynamic car-planning system (DCP) implemented by the U.S. Class 1 rail operator CSX in 1997(1) . The DCP is the industry’s first real-time, fully integrated equipment distribution optimization system that CSX uses to optimize the use of its rolling stock. The company estimates that DCP saves it $51 million annually compared to the previous system, and has enabled it to avoid some $1.4 billion in capital expenditures owing to the network efficiencies it has unlocked.

Over the last decade CSX has invested in enhancing the DCP system. For example, it has improved the system’s real-time reporting information on train operations and the status of cars, and introduced a web-based order management system and visibility tools.

Even more advanced freight traffic planning tools are now being introduced and developed. Companies such as decision automation and optimization solutions provider Optym have compiled case studies of these applications that show the benefits. Optym experts developed a number of optimization solutions for some of the most important transportation service providers in the U.S. Examples include a blocking optimizer for generating an optimal blocking plan for railway freight traffic for Norfolk Southern railway, and a planning model for optimal repositioning of empty containers for Pacer Stacktrain.

Solutions like these are integrated into everyday operation planning, and contribute to significant savings in time, money and distance.

Research at ZLC is focused on enabling railways to increase their share of the overall market for freight transportation. Even though the rail mode delivers cost-effective transportation on long-haul routes, it commands only a relatively small portion of the market for moving freight – one of the most important economic activities in the world. The reasons for the shortfall lie in service inefficiencies, particularly in relation to transit times and on-time delivery performance. The ZLC research is looking at possibilities for improving the utilization of capital assets on railways by incorporating real-life constraints as much as possible. Also, since containerized cargo represents a significant share of railway transportation in the U.S. as well as in Europe, expanding the use of modern optimization tools in the intermodal rail market is another potential option for increasing the mode’s market share.

Ease the burden

Optimizing the flow of goods at the strategic, tactical, and operational levels, will enable companies and governments to increase the productivity of transportation systems, and relieve some of the pressure on overburdened freight networks. We now have the tools to achieve these improvements – and build even more powerful decision support systems for freight transportation planners and their shipper customers.

(1) CSX Railway Uses OR to Cash In on Optimized Equipment Distribution, Michael F. Gorman Department of Management Information Systems, Operations Management, and Decision Sciences, School of Business, University of Dayton, Dayton, Ohio, Dharma Acharya, David Sellers CSX Transportation

Does it have to be complicated to get a lean warehouse production?

CONTRIBUTION BY ROBERTH KARLSSON – EXPERIENCED SITE MANAGER in LOGISTICS 

Many executives believes it is an expensive, long and complicated process of implementing lean in the warehouse. In my experience, it does not have to be that way. What you need is the right kind of leadership, curiosity and courage.

Today’s modern approach to warehousing or as I want to call it warehouse production put high demands not only on continuous improvement but also continuous cost reduction. One of the greatest tools in my opinion to meet those demands is lean.

Lean is a wonderful tool. You can use it in almost every business from hospitals, administrations, productions or in warehouses for example. Many people want to complicate lean but in my opinion it does not have to be complicated and you don´t need an expensive education to start a lean implementation in your warehouse. You can start with inspiration from colleagues in the same business for example.

Lean have a perfect approach to improvements and cost reduction because you try as long as possible to work with current resources you don´t start with a ROI calculation quite the opposite actually. You look on waste and time thieves. You questioning every process you do in the warehouse.

Warehouse is a very good place to start with lean because you often get quick results. The reason to that is because lean is all about reduce operations and processes that not add value to the products, as you can imagine there is a lot of those in a warehouse. The whole warehouse is actually a big margin sinker.

There is many areas to look into, for example:

  • Transportations costs, in warehouse we move products all the time. We make goods receiving and put away. We pick and pack. Sometimes we move the product to a location that is more suitable. We sometimes do a refill from buffer. As you can imagine there is a lot of transportation time.
  • Waiting, if we have not made a good flow analysis it can be a lot of waiting. Waiting in the packing area, waiting at picking locations (high frequent locations) and waiting on buffer refills and so on.
  • Any kind of defects like picking errors that results in returns or transportation damages because of bad packaging.
  • Bad equipment like forklifts that does not work or maybe not suitable for the purpose.

The list can be long with subjects that you optimize with lean in warehouse. Your creativity set the limits.

Standardization is an important part of lean that includes both quality and productivity. If you have a “best practice” solution it is important to make that a production standard to get proper results. It demands a strong leadership with great communicative skills to get people understand why they should follow the standard procedures.

Lean requires a humble approach from the management and employees ideas must be given serious consideration in order to get the employees to feel like a highly valued company asset. As I have written before in previous articles, you need to have a trial and error mindset in the warehouse to evolve. It is important that the employees are not afraid to be punished for making a mistake.

The management need to communicate the reason to continuous improvement and cost reduction. Without a purpose, the employees get lost and loose energy to be creative. You need to explain the importance to evolve in order to be competitive.

Measure what is important. In my opinion, many companies measure too much. They have too many KPI´S, with questionable value to the economic impact. Make it easy for the employees to understand and use KPI´S that is easy to follow up in warehouse production.

Don´t be afraid to try new things immediately. Act as a true leader and show that you are serious about the lean implementation, put on your work clothes, and participate in the change process. If you have a new packing area layout for example participate in the work with moving everything around. Don´t analyze everything too much, as I wrote before if it does not cost more than some man-hours to do the change use “trial and error” to see if it works.

If you want inspiration about lean I recommend you to read: ”Lean Thinking: Banish Waste and Create Wealth in Your Corporation” James P. Womack and Daniel T. Jones. This is one of the first major books that described lean and the positive impact. The first edition came out 1996, but is available in revised and updated edition.

If you implement lean for yourself and feel like this could be something big, I do recommend investing in some kind of training/education for both yourself and your staff. In this way, you keep your staff motivated and give them inspiration. It doesn´t have to cost a fortune for a couple of days training. But in my opinion you don´t need to buy expensive lean consultant hours to valuing your operations, remember that you and your staff is the expertise in your warehouse production but a training give you a new angle when you look at the warehouse production.

Static Inventory an Untapped Source of Working Capital

BY OUR CONTRIBUTING PARTNER ZARAGOZA LOGISTICS CENTER (ZLC) 

Inventory management policies that fail to keep pace with shifting product demand can lock up valuable working capital, especially in volatile markets. By dynamically managing inventory without compromising service levels, companies can free up these unexploited reserves of working capital.

A research project at the Zaragoza Logistics Center, Zaragoza, Spain, has developed models for achieving these goals. The work was carried out by Rajesh Kella and Christos Agrogiannis in collaboration with the global chemical company Clariant for their MIT-Zaragoza Master of Engineering in Logistics and Supply Chain Management (ZLOG) thesis. *

Companies commonly use inventory management policies that employ standard formulas for specific demand distributions and remain unchanged for several years. It’s often easier to continue with current practice, particularly where portfolios include hundreds or even thousands of products stored in hundreds of locations.

In the meantime, however, demand patterns can change, and the policy parameters can become outdated. Forecasts inaccuracies and unrealistic service level targets make it difficult to effectively balance supply with demand for each product.

The phenomenon can be particularly damaging in fast-moving businesses where product life cycles are short, or in markets that are inherently unpredictable.

Thesis sponsor Clariant faced the latter challenge. The research focused on a single business unit in South America, where economic performance in the region’s emerging countries can be erratic. In addition, warehouse replenishment processes lacked transparency and differed from one part of the region to another. Managing inventories across multiple countries required too much manual work and firefighting.

Safety stock

One of the research objectives was to identify the factors that influence safety stock in the region. The other key issue addressed by the researchers and one that is central to the idea of freeing up financial resources through improved inventory management is achieving the right balance between net working capital (NWC) and speed of response.

The tradeoff stems from the fact that lower inventory levels are known to liberate working capital, but at the same time damage speed of response. If stocks are cut too much, service levels can decline to a point where the company risks alienating or losing customers.

Companies try to employ inventory management practices that minimize the amount of working capital they commit to stored product while maximizing responsiveness. But this is very difficult when these practices have stagnated and are out of step with market demand.

Inventory management

A solution is to carefully monitor the fluctuations in demand over time, and make the inventory management policies dynamic so they can flex with the market’s ups and downs.

In the business-to-business markets served by Clariant, customer orders are either fulfilled from available stock the faster option or from the next incoming shipment. Speed of response is measured as the percentage of customer orders that are fulfilled on time.

The research project encompassed 16 affiliate warehouses in eight South American countries. This network of facilities, fed by a global distribution center in Europe, supplies the region.

The factors that impact NWC and responsiveness are forecast accuracy, inventory level, inventory in transit, target service level and lead time. Interactions between these factors influence overall performance. For example, an improved forecasting system increases forecast accuracy which reduces uncertainty and the need to hold high levels of safety stock.

These factors are driven by product segmentation strategy, inventory policy, and network design, and the researchers looked at each of these drivers to determine how they can be shaped to meet the project’s goals.
For example, in order to differentiate the replenishment process for every SKU, the researchers reviewed two key considerations: the sales performance and demand predictability of each SKU. This means that the segmentation was not based solely on the sales performance as in the standard ABC classification, but also on demand variability. They segmented the products so that higher service levels were assigned to the most profitable and predictable ones. Less critical, low demand/unpredictable SKU’s were assigned lower service levels in order to reduce inventory holding costs.

Specific models were established for the critical items, rather than standard ones that are not effectively attuned to market conditions. Simulation models that mimic real-life operations were used to analyse demand distribution in detail instead of simply assuming normal distribution, and to optimize management policies. The flexibility of these models makes it possible to investigate future scenarios where constraints such as minimum order size and supplier capacity change.

The software tools used to model replenishment processes and adjust inventory management policies are commonplace in the supply chain field. And although the project focused on the business-to-business operations of a major chemical company, the modelling methods can be applied to any market.

The researchers report that dynamic segmentation strategies and inventory policies can reduce inventory levels by as much as 32% for certain products, and help strike a balance between NWC and speed of response. How frequently inventory management policies for high-performing products are modified depends on variables such as the type of product involved and the maturity of the market. But the end result should be the same – dynamic inventory management and the availability of more working capital.

S&OP, a vision for the future. An interview with Eric Tinker

CONTRIBUTION BY NIELS VAN HOVE – FOUNDER AND DIRECTOR TRUEBRIDGES CONSULTING

Introduction

In the last 30 years S&OP improved performance in many businesses. However, S&OP has not yet substantially delivered on its ultimate promise of enterprise wide resource management, rolling financial forecasting and strategy deployment. Whatever maturity model or consultancy support companies use, S&OP seems to get stuck. Worse, overall S&OP development and progress seems to have stalled. It sometimes seems like S&OP is stuck in a time warp, where the same old things as 30 years ago are being discussed. On top of this we can see examples of marketing driven service providers that very doubtfully brand their product S&OP, or make up new names for existing S&OP processes. The S&OP Pulse Check 2015 suggests S&OP practitioners are left behind in confusion:

  • 62% of respondents think there is not enough innovation in S&OP systems
  • 64% think there is not enough coordinated innovation in S&OP processes
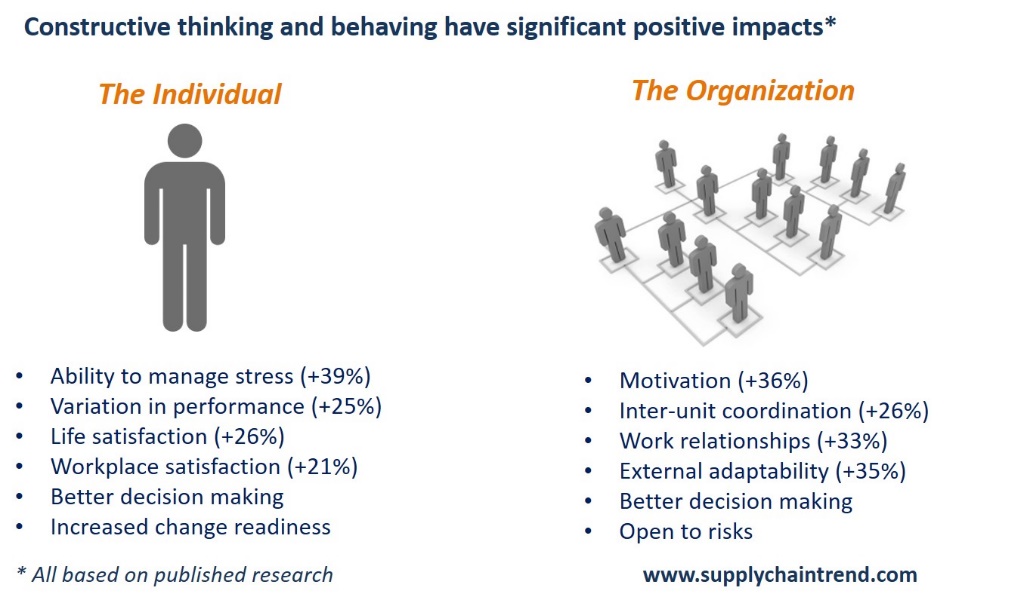
  • 68% think behaviours are not addressed enough in S&OP implementations
  • 71% think we need more industry standards around S&OP

Where to go from here for S&OP?

To get some answers for S&OP practitioners, Niels van Hove founder of Supply Chain Trend, interviewed a group of S&OP leaders. These leaders all have 20+ years S&OP experience and published books, whitepapers and articles in renowned magazines. A group, eligible to comment on the current state of S&OP. A group, that has shown passion to improve S&OP and a willingness to provide ideas for the future. Supply Chain Trend will publish a weekly Q&A with these S&OP leaders.

eric-tinker-bio-headshot-2016In this week’s interview: Eric Tinker, Managing Principal Nexview Consulting.

Eric Tinker leads Nexview Consulting and has spent the last 20 years in management consulting helping clients achieve large-scale change within their organizations. His client experience spans several countries and ranges from helping start-ups to leadership of large, complex, multi-geography business transformation. Eric focuses on Sale & Operations Planning (S&OP) as well as improving the supporting processes, information systems and organizations to help clients leverage S&OP to be the platform for continuous improvement. He has taught and consulted on S&OP and supply chain management across 5 continents, has published several articles, and is the author of Sales & Operations Planning RESULTS. His industry experience includes Consumer Goods, Chemicals, Life Sciences, Energy, and High Tech among others.

S&OP, a vision for the future interview

SCT: Can you describe your first involvement in S&OP?

Eric: Years ago, I was a seasoned, but still developing supply chain consultant in a firm that mainly specialized in plant operational productivity improvements. We sold a supply chain project based on some peripheral supply chain work we did at a plant and I was the tallest midget for this new project. I’d heard about S&OP and searched for any knowledge within my own firm, but didn’t come up with much here or on the nascent world wide web either.  I read Wallace & Stahl’s first book over a weekend and went in and ended up leading delivery of a global S&OP implementation over the next several months.  Part of working as a consultant in a generalist firm was working out of your comfort zone, so I was fine and the client never knew it was my first S&OP rodeo. With a great client team, it was very successful and involved multiple international geographies, IT, some re-org, and KPI movement.

SCT: How would you describe your personal passion for S&OP?

Eric: From the experience above, I said – “Hey this process is the nexus of managing a business, and I can make a career making a real impact with clients by just doing this.”  It was a few years before I was able to make that jump, but never lost sight and have never looked back since making the jump almost 10 years ago. For me, it’s a way of life and how the story will end.

SCT: According to most maturity models, S&OP stalls or even fails. Why do you think this is?

Eric: What I find is that as with most things, clients usually know what to do, but struggle with execution. It’s easy to put off an S&OP improvement for another month, such that the current burning fire can be extinguished.

SCT: What do you believe can be done about that?

Eric: Many companies view S&OP only for its collaboration benefits. Who can agree with getting everyone on the same page with a common set of plans and making decisions that are best for the whole? But – they get caught up with lots of “good ideas” as described above and fail to connect S&OP with business results. They fail to internalize that S&OP is not an additional thing, but is the thing that manages the business and the other good ideas.

SCT: What else significant is missing in the current state of S&OP?

Eric:

  1. While some have it, we generally need more visibility of profitability in the conversations. One implementation we did, had margin right along with the revenue stream in the financial parts of Demand Review.
  2. For some applications, we can also use more external partner collaboration. Why not plug-in a key contract manufacturer into your Supply Review(s). Note my emphasis on “some applications”.
  3. Our research and experience shows that Portfolio Review is still an untapped opportunity for most companies to include in the process. It’s not a fit for everyone, but for many it’s a great way to keep the portfolio under control and connect market driven priorities with the rest of the business.

SCT: What do think are some of the fallacies about S&OP?

Eric:

  1. Parts of the service provider market continue to cause confusion over what S&OP is to suit their own marketing purposes. Several companies also call the tactical execution they do S&OP. I’ll leave it there for now.
  2. That designing S&OP and putting it in are easy. Sure – the components aren’t too tough to grasp and you can start the meetings. Getting consistency across your S&OP design, org design, regional/BU and global levels, integrating new acquisitions, IT hierarchies (operational and financial), while keeping busy people engaged, isn’t always easy in a complex business.
  3. “This isn’t an IT thing.” Sure – you can get to a design and pilot on Excel, but try to scale it sustainably in a complex global business on spreadsheets without burning out your staff? Who wants that job in the long-run, good luck.
  4. There’s one set of “best practices” that fits all. There are some who claim based on all their self-proclaimed experience, they have the right way. A good suit is a nice place to start for looking good, but suits need to be tailored to every person and S&OP is no different.

SCT: How would you describe your future vision for S&OP?

Eric:  S&OP is the just the way we do business, it’s not something new or unknown. We have a connected global management team that is armed with process, information, and decision support to make the most profitable intermediate term decisions that “operationalize” the strategy while monitoring the underlying process execution and associated metrics.

SCT: What needs to be done to reach that vision?

Eric: We work with clients by focusing on “8 Levers” to make measurable progress in S&OP maturity. These levers are:

Vision: Define what S&OP is and is not, what it does for the business, and what results will come from it.

Sponsorship: What this named executive does to ensure S&OP success should be explicitly defined.

Design: Design S&OP to match your org structure, financial reporting structure, and your data hierarchy/structure must align to this.

Organizational Alignment: Not only should your organization align around S&OP for collaborative management and decision making, the process needs to align with your structure to get the accountabilities in the right places as well as match the reporting roll-up.

Reports & Tools: This includes formats of reports, tools/training guides, meeting procedures, action logs, meeting scorecards/maturity tracking, the mechanics all need to be tight.

Enabling Technology: This is a must for sustainability for reporting sustainability and scenario modelling/decision support.

Results Management: Sure, S&OP is a great idea, but if it’s not driving business results that can be measured, why bother?

Change Management: Informal coaching, stakeholder management, as well as tangible techniques to measure progress are all part of this.

We’re pretty big on these items to reach an overall vision of mature S&OP. If you’d like to see more, you can see an extended video and download an infographic on the 8 Levers for S&OP Performance

SCT: Since S&OP has been around since the 80’s, aren’t most companies doing it by now and opportunities are limited?

Eric: That’s a little like saying opportunities for improvement and business itself are limited. I continue to be amazed by many companies who are successful, despite what I see or hear about what is going on inside. I see people working very hard, but the gaps demonstrate how much better we can get. Companies are also in their own maturity cycles, so new ones needing to implement or improve S&OP are always emerging.

Uncertainty, complexity, and variability continue to create opportunities in the marketplace. Teams don’t have to have it all covered all at once, they just need to be better than the next guy. If you’re not managing these challenges and opportunities through S&OP, then you’re likely not on the leader-board, or perhaps you’ve found the fountain of youth, perpetual motion machine, or that lucky pot of gold.  Some companies may have a head start based on positioning or just great products, but the market is not far behind.

SCT: What is your message for S&OP practitioners, who are struggling to make progress, or who are looking for guidance?

Eric:

  1. Without the help a passionate executive who can mandate this and/or provide the environment for success, you should focus on finding that executive to work with (perhaps in another company) rather swimming upstream on your own.
  2. Take a maturity model and modify it to suit what makes sense for your company. The maturity model should educate/communicate, align people, manage scope, and set expectations for what needs to happen by when. Work IT maturity into the mix here too.
  3. Tie this process to measurable business results, numbers are harder to argue with.

Measuring the non-financial benefits of strategic sourcing

CONTRIBUTION BY JONATHAN O’BRIEN – AWARD WINNING PROCUREMENT AUTHOR

It’s all about savings, savings, savings! Once upon a time such a statement would have rung true for most procurement functions. But times have changed. In a post-recession and ever more volatile, fast-changing and unpredictable world, the leading companies are organized so that procurement functions are focused on securing much more than price down.

Added value, risk minimization and innovation are increasingly as, and even more, important than savings. If the organization is trying to create competitive advantage by exploiting new and unique ideas and technologies from its suppliers then, whilst price will always be a consideration, it is no longer the only show in town.

CPOs and procurement functions typically need to demonstrate their contribution and the success of their interventions within the organization and across the supply base. The problem in almost all companies, however, is how to measure and show the value of the non-financial benefits – especially in organizations that judge performance only by financial results.

The problem with using only financial and efficiency measures

Neely et al (1995) define performance measurement in organizations as “the process of quantifying both the efficiency and effectiveness of actions” whilst Dumond (1994) suggests it is necessary “to support the achievement of goals with the intent to motivate, guide and improve an individual’s decision making”. Performance measurement is the way firms determine on an ongoing basis that they have the capability to prevail and achieve. The concept has been around for over a century now and originated as accounting systems, mostly developed in the early 1900s, to support manufacturing products in batches (Cunningham and Fiume (2003)). Since then, measures based upon financial accounting have been the primary means by which organizations have understood and corrected performance. The shortcomings of these existing ‘finance only’ approaches are well documented (Kaplan and Norton (1996), Neely et al (1995), Johnson & Kaplan (1987), Dixon et al (1990)). So, for performance measurement to be effective it must consider more than financial measures.

In procurement this presents us with a challenge. Traditionally, procurement functions have concentrated on measuring the overall contribution of the purchasing function using umbrella metrics such as price savings achieved or other efficiency-based measures (Cousins et al (2008)). Typical measures used by procurement functions include Purchase Price Variance (PPV), Price savings, Cost savings, Contribution to EBITDA, Cash retention, Return on Investment (RoI) and Cost of inventory. Whilst such measures are entirely appropriate to demonstrate how procurement adds value, they are, however, limited and assume the organization requires procurement to deliver only financial and efficiency benefits.

Increasingly, organizations need much more from procurement – and such measures do not reflect the full extent of a modern strategic procurement function that is helping add competitive advantage to an organization. In fact, the preoccupation with such measures may detract from more useful indications of how procurement performs (Cousins et al (2008)).

You are what you measure

There is a further problem here and, as the old adage goes, ‘you are what you measure’. This suggests that if we measure something then that will in some way drive outcomes. If we measure procurement performance purely based upon financial measures, there is little incentive for those within the function to work towards anything other than price reduction. This dynamic has been seen at play in some large retailers where buyers’ performance, and indeed personal bonus payments, have been linked to savings delivered; the consequence being a brutal approach to beating suppliers down on price and maximizing short term gains. Without any other balancing factors, a team driven by price down will maximize organizational profits in the short term, but may sell the family silver to do so.

Procurement performance is a business-wide concern

Whilst procurement would typically manage suppliers and sourcing, suppliers don’t typically serve the procurement function. Instead, they serve an entire business and have relationships and stakeholders across the whole firm. Other parts of the business are interested in supplier performance and so would be interested in the performance of the procurement function to manage supplier performance. Other functions tend to be less interested in financial and efficiency measures, but can be more interested in factors such as operational effectiveness, responsiveness, quality, and ability to innovate. Any arrangements to measure the contribution procurement makes to an organization cannot ignore these wider business needs as it is the complete picture of supplier performance combined with performance of the procurement function that demonstrates the effectiveness overall of the procurement function.

Developing a balanced approach to measure financial and non-financial benefits

Thus, how we measure the effectiveness of procurement drives behavior and demonstrates contribution whilst also being a business-wide concern. Today’s leading procurement functions are strategic contributors to overall business success in both financial and non-financial terms. Demonstrating this requires new approaches and new thinking, but firms struggle with moving from old finance-based benefit measurement to a more balanced approach. There are, in fact, four key steps that can help here:

  • Step 1 – Change the way the firm thinks It may seem odd to suggest such a thing, but working to change the mindsets of those who run the enterprise represents the biggest opportunity here. If the entire business is set up and run based upon financial measures only, then thinking and behavior will be finance-based and reporting will be largely numerical. Considering non-financial benefits is not about abandoning this, but rather complementing it with other descriptions of how specific supply base interventions are helping the business. This is nothing new and forward thinking accountants running organizations have long since looked beyond the safety of direct financial benefit to demonstrating how other forms of value contribute. And that brings us to step 2:
  • Step 2 – Quantify as much as possible Most forms of benefit can be converted into a measure somehow. They may just require some interpretation and creative thinking. There are two dimensions to this. First, converting soft measures into a number. This happens the world over when, for example, a person’s view or judgement is the basis for measuring something using surveys that ask us to ‘strongly disagree’ or otherwise convert a judgement into a number that can be processed and compared. Second, it is about linking a particular intervention or action to an overall goal or measure. And that brings us to step 3:
  • Step 3 – Show how intervention contributes to a bigger, measurable, goal A filmmaker’s success is ultimately judged by box office sales. Music labels give musicians the space to do their thing but expect to see a successful album. Pharmaceutical companies invest millions in the unknown of Research and Development but hope for the next blockbuster drug, and so on. So how does this relate back to procurement? Sadly, there is little relating it back. I don’t know of too many companies where those running the business might talk of taking a risk on investing in a procurement function that they hope will unlock new innovation from the supply base. Therefore, one of the most powerful things a CPO can do is demonstrate how the actions and activities of the procurement function contribute directly to the success of the organization. And that brings us to step 4:
  • Step 4 – Tell the story! Where the benefits are non-financial, traditional scorecards and number-based reporting mechanisms often mean that anything non-quantifiable doesn’t get reported. This perpetuates the problem. Instead, procurement should tell the story of how procurement intervention is contributing directly towards the achievement of key business goals. This means both attempting to turn non-financial benefits into some sort of number, eg: “This month procurement are pursuing four innovation ideas from suppliers to help develop our new product”. It is also about promoting a commentary that sits alongside financial benefit reporting to tell the story and adopting a different approach to reporting that allows this. It requires procurement functions to start selling themselves and driving a managed program of communication and self-promotion, as if it were an outward-facing function. If the benefits of appointing one supplier over another provide improvements to the community and this is an organizational goal, then there is a great success story that is as powerful as any scorecard of financial performance – provided the right people get to hear about it.

References

Cousins, R, Lamming, R, Lawson, B & Squire, B, (2008), Strategic Supply Management – Principles, Theories and Practice, FT Prentice Hall, Harlow

Dixon, J.R., Nanni, A.J. and Vollmann, T.E. (1990), The New Performance Challenge ± Measuring Operations for World-class Competition, Dow Jones-Irwin, Homeood, IL

Dumond, EJ (1994) Making best use of performance measures and information, International Journal of Operations and Production Management, 14 (9), pp16-31

Cunningham, J E, & Fiume, O J, with Adams, E (2003), Real Numbers – Management Accounting in a Lean Organization, Managing Times Press, Durham, NC

Johnson, H.T. and Kaplan, R.S. (1987), Relevance Lost – The Rise and Fall of Management – Kaplan, RS & Norton, DP (1996), The Balanced Scorecard, HBS Press, US

Neely, A.D., Gregory, M.J. and Platts, K.W. (1995), Performance measurement system design: a literature review and research agenda, International Journal of Operations & Production Management, Vol. 15 No. 4, pp. 80-116.

Improving behaviours in support of world class S&OP: Coach for Excellence

CONTRIBUTION BY NIELS VAN HOVE – FOUNDER AND DIRECTOR TRUEBRIDGES CONSULTING

An S&OP implementation requires many changes, not the least behavioural change.  However, practitioners indicate that behaviours are not addressed enough in S&OP implementations. There are different behavioural change requirements during S&OP maturity stages.  In three posts, three coaching phases will be explained to support leaders with behavioural change in their S&OP journey. These are; Coach to change, coach to sustain and coach for excellence; coach for excellence.

Once a strong foundation of trust and communication is developed and many senior S&OP stakeholders have improved communication and display trust behaviours, the next phase is to coach for excellence. Coaching for excellence requires to go under the surface of the iceberg to help individuals develop more effective mindset, self-thoughts and behaviours. The objective is to reduce individual and group obstacles that hold back effective behaviours and performance.

To start coaching for excellence, it is useful to have a proven and objective behavioural measurement as benchmark and conversation starter. Furthermore, we need a coaching method to give structure to the conversation and guide the individual change process.

Advanced behavioural measurement

To create behavioural awareness, we need an objective measurement. This is often where psychometric measurements come in. A psychometric tool simply seeks to make predictions about some of the aspects of people completing it. However, a business needs to be careful to select the right tool to improve behavioural effectiveness and performance.

Well known psychometric tools like DISC and Myers-Briggs are very valuable to helps individuals to understand themselves and others. However, these tools measure preferences or personality rather than thinking styles, behaviours or mindset. Personal preferences are relatively stable and hard to change, whilst self-thought, behaviours and mindset can be changed through coaching.

As the most used psychometric tool in the world, Myers Briggs is based on only one psychologic insight; Carl Jung’s theory of psychological types, whilst other tools use a variety of well-known psychologist. But most importantly, in Myers Briggs, no preference or personality type is considered ‘superior’ or more effective to other preferences. If our objective is to seek more effective S&OP and performance improvement through behavioural excellence, we therefor need a psychometric tool that provides a strong basis for that. Personality measurements hardly provide that basis.

Psychometric tools like Mental Toughness, Life Styles Inventory (LSI) and Emotional Intelligence do measure thinking and behaving, are proven to be changeable and are positively associated with better individual health, well-being and performance. The below graph show some researched examples.

behavior-measurement

Mental Toughness is positively associated with up to 25% of performance improvement, reduced stress and better decision making under pressure. The constructive behavioural styles in LSI are positively associated with inter-unit coordination, work relationships and external adaptability. These are all very important aspects of S&OP and measuring and improving the thinking and behaviours associated with those aspects will make S&OP more effective.

Coaching Models

To coach individual to improve their behaviours, we can’t just tell them what effective behaviours, how to think and behave and then expect that this will change. We need to help them create awareness and help develop more effective behaviours.

It takes structure and a considerable amount of time to make individuals aware, accept and take action on their mindset and behaviours.  Many people are not even aware of some of their behaviours and the impact on themselves and others. To structure conversations and help with the individual change management we can use coaching models. Two straight forward coaching models are AAA and the GROW model.

The GROW model starts with the Goal, the end point where the coachee wants to be. Once the goal is clearly defined, the focus is on the Reality, to create an understanding on how far they are from reaching their goals and what issues and challenges they have. Challenges and issues will define the Obstacles for which Options can be identified. That last step is to convert options to actions and a Way forward.

Using the AAA model to support individual change, a coach has to create behavioural Awareness in the coachee. Then a coach needs to guide an individual in Accepting that these behaviours are not effective. Without acceptance we can’t move on to the next step; Action. Once an individual has accepted a need for change in their behaviours, a coach can help create an action plan to develop more effective behaviours. The coach will follow through and hold a person accountable to stick to the improvement plan. A coach will also provide intervention techniques a person can use in real life situation like an S&OP meeting.

grow-model

Impact on S&OP effectiveness

A critical mass of senior leaders with increased self-awareness, emotional intelligence and the willingness to detect, manage and improve their own behaviours, will have a positive effect on S&OP effectiveness and business in general. The boardroom environment, S&OP meetings and day to day business will show improved listening, constructive challenge to come with better solutions, risk appetite, commitment and follow through on actions. We will see improved relations with better cross functional working and individual satisfaction, health well-being and performance.

impact-sop

These boardroom improvements are very real to support business growth! Take the example of a senior executive from a multi-billion $ company I coached. With the help of the Mental Toughness psychometric tool, we discovered that this individual struggled with challenging the CEO and peers in the leadership team. A lack of challenge in the boardroom, leads to Groupthink.

Groupthink is a psychological phenomenon, which occurs when a group of people, in which the desire for harmony results in an irrational or dysfunctional decision-making outcome. The whole boardroom goes along with the same decision, because it is easier. In a recent interview in the Australian, chief executive of the Australian Institute of Company Directors, John Brogden, states that Groupthink is the greatest risk to corporate growth in Australia.

Once my coaching counterpart developed this awareness, the coaching conversation could focus on how to address and improve challenging the status quo in the boardroom. A lot of the coaching conversation focused on self-thought, self-confidence and techniques on how to work towards asking a tough and challenging question to the CEO. Coaching this individual on personal traits like confidence and challenge did unlock hidden potential, helped this individual and indirectly the business.

Once a critical mass of leaders and S&OP stakeholders show effective mindset and behaviours, S&OP effectiveness will increase. With increasing process and behavioural effectiveness, the S&OP meetings will become the most important governance structure in the business, significantly supporting company performance and influencing a more effective and positive company culture.