How Industry Benchmarks Can Boost Your Asset Recovery

CONTRIBUTION BY Dan Gettens – Chief Analytics Officer, OnProcess Technology

Are you confident your company is achieving the best possible asset recovery results? Do you know whether your return rate could go a few points higher? Or how feasible it would be to slash five, 10 or even 20 percent off your days of inventory?

If not, you’re not alone. Most businesses don’t know what’s truly achievable for companies of their kind. As a result, most asset recovery goals are guesstimates. Often, they’re not aggressive enough, which means companies are leaving a lot of money on the table and dissatisfied customers in their wake.

To reach true asset recovery potential, you need industry-appropriate, well-vetted benchmarks that you can measure against, aspire to, and then, with the right plans and best practices, attain.

Asset Recovery Benchmarks by Industry

Best-in-class asset recovery benchmarks vary by industry, as you can see by the below sampling (figure 1). This makes sense, since it’s affected by the maturity of each industry’s asset recovery practices and the make-up of their customer base. For instance, the medical figures reflect the fact that many medical equipment OEMs have recently begun expanding from selling solely to businesses (i.e., hospitals, physician groups) to also targeting the burgeoning at-home consumer market. Recovering devices from the latter group entails different challenges and requires a different set of skills and processes. In addition, rampant growth in both business and consumer market segments is leading many medical device OEMs to focus more on driving efficiencies.

Similarly, the wireless industry figures reflect that, in addition to supporting advanced exchange programs, wireless companies are introducing and increasingly relying on leasing programs. Service providers are adapting asset recovery practices to handle the resulting spike in disconnected, non-pay customers and the need to accelerate advanced exchange for higher-priced handsets.


  Recovery Rate Day 90* Return Velocity (Days)** Days of Inventory**
Technology OEMs 93.3% 16.2 22.2
Medical Device OEMs 83.1% 22.3 40.9
Broadband Service Providers 90.0% 17.1 28.7
Wireless   Service Providers 86.9% 13.8 23.8

Figure 1. OnProcess Asset Recovery Benchmarks, Fall 2016. Based on 6,755,678 transactions.

* Higher is better

** Lower is better

Best Practices Drive You Closer to World-Class Results

Best practices for attaining those benchmarks measure in the dozens. They also vary by industry – and continually evolve as new technologies and methodologies come on the scene.

For example, predictive analytics and segmentation are gaining traction in technology and medical device asset recovery, but are just beginning to demonstrate improvement and impact results. Use of Internet of Things (IoT) for improving recovery rates will be equally compelling, but is currently in the planning stages. As these and other data-driven processes and automation advances are incorporated into asset recovery, and more companies move along the digital transformation path, these benchmarks are likely to get even more aggressive, while the effort to attain them is likely to get easier.

That being said, world-class asset recovery operations all benefit from Voice of Customer, business rule-based scripting and Propensity to Return analytics:

Voice of Customer initiatives capture, analyze and generate actions based on agents’ verbatim notes from interactions with customers. They provide newfound visibility into customer viewpoints and often uncover issues that clients didn’t know exist—both of which are critical for continual process improvement. In fact, many times customers suggest new, and very viable, remedies to address root causes.

  • Clear business rules for messages are also essential. They spell out the exact information agents should convey to each customer in brief, focused voice messages.
  • Propensity-to-Return is a form of predictive analytics. It entails analyzing historical data to create a scoring model that indicates who is more likely to return assets. You then create strategies to segment customers based on how they should be approached and where to focus proactive outreach, and develop tailored messages that meet the distinct needs of each group: those with high propensity to return, disengaged customers and those who are underserved. This enables you to achieve faster returns with less effort.   

Industry Benchmarks Are Not a ‘Nice-to-Have’

When it comes to optimizing asset recovery, industry benchmarks are essential. They enable you to develop sound, realistic goals instead of guesstimate targets. With these benchmarks in hand, you’re empowered to create and implement action plans that result in the best possible recovery rates, velocity and days of inventory and deliver the largest cost savings, efficiencies and customer satisfaction improvements.

How to Avoid the Most Common Warehouse Safety Hazards

Contribution by Megan Ray Nichols STEM Writer & Blogger

According to the Occupational Safety and Health Administration, or OSHA, the rate of fatal injuries for warehouse work is higher than the national average. Warehouses are full of potential safety hazards, but employers and workers can minimize these risks by taking proper safety measures.

Being informed about common dangers is vital to protect against them. With that in mind, here are six of the most common warehouse safety hazards and how to avoid them.

1.      Slips and Falls

Preventing slips and falls may seem like common sense, but the warehouse environment can make them more common and more dangerous. Workers may encounter tripping hazards, they may have to work at heights and they might be surrounded by equipment they could hit as they fall.

To prevent these types of injuries, warehouses need proper safety training and safety procedure implementation. The workplace should emphasize awareness of surroundings. Floors, doorways and any other areas workers may walk through should always be free of clutter and debris. Be sure also to mark wet floors. OSHA also recommends that any location where an employee could fall 4 feet or more should be blocked off with a chain, rope or another barrier.

2.      Falling Objects

Another frequent warehouse accident has to do with workers being struck by falling objects. In 2013, this caused 20 percent of reported injuries and deaths. Depending on what the object is and how much it weighs, these incidents can be serious.

To prevent this threat, workers need training on safe handling and storage of materials, and employers should conduct safety checks regularly. Employees should always stack objects evenly and straight while also interlocking, blocking and limiting the height of piles. Workers should also remove one item at a time from shelving.

3.      Forklift Accidents

Operating forklifts is one of the most hazardous warehouse jobs. Improper use of forklifts results in numerous injuries and deaths every year. Overturned forklifts account for about 25 percent of those deaths. Improper operation can presents risks to both the driver and the workers around them.

Before driving a forklift, workers need to participate in training as well as an OHSA-approved safety course and become certified to use the equipment. Those operating the machines should be aware of its load capacity and be careful not to overload it. They also need to be aware of their surroundings at all times and not drive more than 5 mph. You should also conduct safety inspections of your equipment before using it.

4.      Electrical Dangers

Electrical equipment can present various risks if relevant safety procedures aren’t followed. Proper wiring, using the right equipment and maintaining quick access to important items all make a difference.

Using multiple extension cords or power strips for one device is a fire hazard as well as potentially a tripping hazard. Extension cords should only ever be a temporary solution. If you need a cord every day for multiple weeks, you should have an electrician install a line and an outlet, rather than using an extension cord. Additionally, be sure that the electrical room is free of clutter and breakers are easily accessible in case something goes wrong.

5.      Mishandled Chemicals

Chemicals are sometimes necessary, but they can also be dangerous. Some chemicals present risks any time you use them, while others are only dangerous if handled improperly. Substances that start off relatively safe can become hazardous over time. When stored for about a year, for example, ether can degrade into peroxide, which is explosive.

Every organization that uses chemicals needs to have a control system in place. All containers used to store chemicals should be labeled with their contents and expiration date. You also need a material safety data sheet for every chemical you use. Employees that handle these materials need training on proper use, storage and disposal, and all employees need to know what to do in the event of a spill, chemical burn or other accident.

This is by no means a comprehensive list of the safety hazards associated with working in a warehouse. It is a start, though, for understanding some of the most common dangers and what to do about them. Following standards put forth by organizations like OSHA and consulting safety professionals can help you improve your safety procedures, and all employees should get the training they need. No matter what industry you work in, safety should always be a top priority.

Out Darn Spot! Out, I Say!

CONTRIBUTION BY DAVID LANDAU, EXECUTIVE VICE PRESIDENT, CLOUD LOGISTICS

The comic Steven Wright once joked, “I spilled spot remover all over my dog.  Now he’s gone.” For shippers who regularly leverage the spot market, it’s been a buyers’ market the last few years. One shipper I’ve worked with saved more than 9 percent on freight spend simply by moving away from only using brokers to using (temporarily) the spot market for almost all of their loads. But, like Wright’s dog, is that market about to be gone?

Let’s start by looking at the numbers. DAT® puts out a weekly analysis of the spot market from the data they gather. An early September report showed that the number of loads on the spot market has doubled year-over-year. Rates have increased 11 percent and capacity is essentially flat. Clearly, all the quantitative indicators are pointing in the wrong direction if you are a shipper. Hurricanes Harvey and Irma and the ELD mandate coming this December are only going to make the market even tougher.

Does that mean companies are going to use the spot market less and less? I doubt it. It plays too important a role for many shippers. Besides, capacity is getting tighter across the board. Some carriers may not be willing to commit capacity in lanes they were previously happy to do so.

What is a shipper to do? Here are a few tips and pointers:

  1. Stay informed. Benchmark data services from DAT, Truckstop.com, and others help planners make wise decisions and have some negotiating leverage.
  2. Investigate new innovations. There are a bevy of new technologies out there that leverage the ‘sharing economy’ to help more effectively marry shippers and carriers. Uber isn’t the only one. Companies like Konexial and Lanehub are starting to do some pretty exciting work.
  3. Invest in proven technologies if you haven’t already. TMS is no longer just for large shippers. They are now more affordable and some can be implemented in days. A good TMS helps shippers more effectively manage capacity and leverage the spot market.
  4. If your contracts are running up soon (or you are shipping on old rates), re-negotiate now. Lock in capacity and a smaller rate increase while you can.
  5. Establish good partnerships with a handful of brokers or 3PLs. They are likely to continue to play a role in your network.

Steve Wright also said, “I couldn’t repair your brakes, so I made your horn louder.” Changes are coming to the market. I’m pretty sure braking won’t make a difference, but if we navigate effectively, we shouldn’t have to use that louder horn.

Information-Based Negotiations in The Digital Age

CONTRIBUTION BY DR. TOM DEPAOLI – UNIVERSITY PROFESSOR AND CONSULTANT

A few years ago, I introduced the information-based negotiation concept.  I defined it as a radically different approach to negotiations. It emphasises deep knowledge of the supplier and their industry. It is different from some traditional approaches to negotiations. It is not the adversarial negotiation style with the emphasis on game playing, theatrics and taking full advantage of a supplier’s weaknesses. In information-based negotiations the purchasing or supply chain professional gains a deep understanding of the supplier’s industry, its margins and its culture. In essence, this is an immersion or empathy with the supplier and the competitive landscape. The best way to describe it is that the purchasing or supply chain professional knows as much or more about the supplier and their industry as the supplier does! They become a data driven industry expert. Below is a graphical representation of the concept.

It requires a lot of homework, data digging, research and flat out work. The approach often leads to a strategic alliance or partnership with a supplier and cooperative ventures. A purchasing or supply chain professional obviously cannot do this with every supplier, only the most important ones. The challenge to the information-based concept today has dramatically shifted.  Technology, data analytics and informational advances are rapidly outpacing any tactics or strategy inherent in information-based negotiations. This does not mean that relationship building becomes less important. Quite the contrary, with new technology growing pains; trust and relationships become even more critical! Below are some of the new emerging technologies that have the potential to take information-based negotiations to a higher level.

Blockchain data verification has at its foundation trust and verification. It can also help understand trends and risks. It promises to practically eliminate non-vale adding work for supply chain professionals thus allowing them to focus on breakthrough ventures and more strategic projects. In fact, the entire procure-to-pay process will be automated.

Virtual reality and spatial analytics will provide a visual record of the entire supply chain and a record what actually happened at every stage that a product experienced. Super enhanced QR code generators will give a complete supply chain “movie” of every step. Instant visual contact will be possible with suppliers’ factories, warehouses and logistics platforms (container ships, aircraft, astronomies trucks etc.) All parties will see any upsets to the supply chain and take immediate corrective actions.

Predictive analytics models will help with total cost of ownership differences, supplier choices, and country and geopolitical risk assessments.

Social media harnessing will greatly improve marketing campaign efficiencies and results. Customers online behaviors will be accessed, understood and met with ever increasing speed. Customers will be able to provide real time feedback on products, packaging and other satisfaction issues. This will help the organization master speed-to-market and better understand the voice-of-the-customer.

An information-based approach has tremendous flexibility to cope with market and industry changes. Information drives supply chain decisions. It requires the supply chain professional to become the resident expert on a market and an industry. The major change here is that now it requires them to understand and take advantage of new supply chain enhancing technologies. Using the information-based approach is one of the best methodologies for transforming your supply chain and developing true breakthroughs with your supplier.

Hurt, help or hero? How to define and get more out of your most important suppliers

CONTRIBUTION BY JONATHAN O’BRIEN – AWARD WINNING PROCUREMENT AUTHOR

Supplier Relationship Management (SRM) focuses on unlocking value from your supply base.  However, to achieve that, you need to identify which suppliers are the most important to your business. 
 
If you can get this process right, you can be confident in knowing that you are directing precious resources to where they will have the greatest impact.  Get it wrong, and you could find yourself missing key opportunities and being at risk of wasting time and energy in the wrong places.
 
You might think that it’s easy enough to identify the most important suppliers. But the reality is that this can sometimes be one of the most challenging parts of SRM.  You can easily find yourself leaning towards suppliers that you know more about, or suppliers that you have had contact with most recently, or indeed the suppliers who have the biggest contract. So it’s critical to take an holistic view of your suppliers and understand what they bring to your company.
 
Defining segmentation
To help you define who is or isn’t important, you first need to look at segmenting your supply base.  To do this, you will need to apply a set criteria to determine why these suppliers are important and what sort of intervention and relationship would be necessary or beneficial.  
 
There are many factors which drive supplier importance and which could be used as criterion and the basis for segmentation. These might include: 
  • Risk
  • Spend
  • Criticality or business importance
  • Future opportunity
  • Sustainability
  • Ability to innovate
  • Market difficulty for the key areas of supply
  • Ability or inability to switch suppliers easily
  • Proprietary or differentiated nature of goods and services
  • Alignment with future goals
  • Culture, style and ways of working
  • Degree of interest and willingness from the supplier
  • Nationality or prevailing religion
  • Alignment with business ethics, beliefs and policies
  • Established relationships and history of doing business (especially relevant in Eastern and Middle East culture)
  • Existing obligations or contractual commitments
  • Geographical locations
  • Distribution channels
  • Uniqueness of knowledge or know-how held by supplier
  • Affiliations, partnerships, group companies, interests held by key stakeholders
  • Accreditations or compliance with regulations
  • Customer or regulatory mandates to use specific suppliers
Key to the segmentation process is keeping your company’s operational goals front of mind when selecting the criteria. For example, if one of the business objectives is to be a pillar of sustainability in everything you do then sustainability andalignment of ethical principles and policies are key to helping you decide which suppliers are important.  
 
Similarly, if you need a particular technology or innovation to help you grow market share, but don’t currently have access to it through existing suppliers, then ability to innovate would be a key criterion to be applied to both existing and potential new suppliers.  
 

Hurt, help or hero?

At the simplest level, there are three reasons why you might need or want supplier intervention – and that is when a supplier could either hurt us, help us, or be a hero for us.  
 
For example, a single-sourced supplier upon which you depend presents risk should it be unable to supply. This is a supplier that could hurt you, say, if it ceased trading. Therefore, your approach could be to conduct ongoing risk management and get close to them to ensure you are not taken by surprise.
A ‘Help’ could be a supplier that has some ability unlock greater value.  If you can work together with a key supplier to speed up how long it takes to respond to a requirement, this might increase your customer performance levels.
 
Heroes are the suppliers that can make a dramatic difference to your organization. For example, a software supplier that has a unique platform or capability that could really enhance your offering might be a supplier with which you can collaborate to develop something new that would bring competitive advantage.   
 
So next time you need to segment your supply base, here’s some simple advice.  Why not consider which suppliers couldhurt, help or become a hero to help you determine the level of importance of each supplier?  This is a quick way to get you started and will provide the basis upon which a more detailed set of criteria or rules can be developed.

Supply Chain Visibility: We Should Be Striving for More

CONTRIBUTION BY Martin Verwijmeren – CEO and co-founder of MP Objects

Everything you know about supply chain visibility is wrong or at the very least it’s limited. You may look at your supply chain today and say “I have good supply chain visibility” but I’d ask you how you define it?

For too long, supply chain visibility has been associated with pure track and trace and/or passive analytics. Our systems may provide some basic visibility but it’s visibility that is not actionable. It tells you what goes wrong but it doesn’t help you ensure that doesn’t affect your relationship with your customers in real-time leaving you better at planning but not better at executing that plan.

The question is how do you make our visibility actionable? How do you encourage and implement your supply chain visibility to better optimize your processes in the moment? How can you truly make visibility a core competitive advantage for your supply chain?

The Three Stages of Supply Chain Visibility

There are three critical areas where your organization may not be reaching its potential with making supply chain visibility actionable.  Below, I will detail the stages I see as the progression forward thinking supply chains are taking to make better real-time decisions on the data they capture.

Stage 1: Visibility: getting the data end-to-end

The first evaluation your organization needs to make is if you are even capturing the right data in the first place. Often times organizations equate supply chain visibility with insight into transportation but this is just scratching the surface for what you should be capturing and there may even be steps in transportation that you should get more granular with especially for international shipments. Manufacturing, warehouse, cross-docking and servicing steps as well as repair steps for reverse logistics can and should all be tracked toward an end-to-end customer order. By tracking the granular steps across your end-to-end supply chain, it enables you to continuously evaluate and build towards optimizing your supply chain as well as helps you set the right expectations with your customers.

The goal is to ensure you have a single source of truth for your customer order. A single place for your team to take action on exceptions for your orders and ensure they arrive on-time in-full (OTIF) to your customer.

Stage 2: Collaboration: making the parties work together

If you identify all the milestone steps you need to measure in your supply chain, you are already ahead of most organizations. That’s not the place to stop, though. With increased globalization supply chains are becoming increasingly multi-party in order to execute and deliver an enhanced experience to their customers.  However, what’s important is that the customer doesn’t associate their overall experience (good or bad) with these parties but with your brand. This makes it critical to have visibility and collaboration with these partners.

This is a huge challenge for most organizations as integration with their current systems and multiple parties often are done piecemeal and maintaining these integrations is a huge undertaking for your internal IT team. It is here that multi-enterprise solutions are providing value to help to connect all supply chain network parties together to give visibility and control over these supply chain investments. All while ensuring real-time accountability and exceptions management across all supply chain steps and parties.

Stage 3: Orchestration: optimizing flows order by order

If you have made it to this stage, you have already implemented reactive action into your end-to-end supply chain execution and strategy. Supply chain orchestration helps you move from reactive to proactive by intelligently leveraging the data you capture in your supply chain to enact your unique supply chain plan and execute the perfect order for customers at the most profitable cost.  By taking into account considerations such as available inventory across the network, lead times, SLAs, available internal and supplier capacity, transportation costs and other factors, your supply chain orchestrates the most effective order flow for each customer and in relation to all other customer orders. Orchestration is about putting your supply chain plan into action automatically to drive ultimate efficiency and create the best experience for the customer.

Real Supply Chain Visibility is About Action

Despite the language of the term, supply chain visibility shouldn’t be simply viewed. It should be used to enact action that helps you consistently optimize efficiently, reduce costs related to inventory safety stock, transportation and activities and most importantly, to deliver the most optimal experience for each and every customer. With the complexity associated with supply chains today, that is incredibly difficult to do with your current systems and strategies. It’s organizations like yours that orchestrate the perfect order every time that will retain current customers, and equally important, win more customers with proven competitive advantage in the supply chain.

How To Spot Supplier Risk During Pickups & Deliveries

CONTRIBUTION BY Ben Goldwasser – Business development professional

To wrap up our series on identifying supplier risk, we examine what you should look for during pickups and deliveries. Earlier articles in the series covered the importance of risk profiling as well as other situations where you should look for supplier risk. If you missed any of these, you can find them here. When it comes time for your carrier to pickup or deliver your cargo, run through this checklist to ensure you’re not working with carriers that will put your business at risk.

Equipment

One of the first things to inspect during pickups and deliveries is the equipment used to transport your cargo. Before any cargo is loaded, identify the exact truck and trailer being used for the job. Make sure the truck and trailer aren’t damaged from previous trips. Also, check the deck of the trailer to make sure it’s intact; and that the rest of the trailer is rust free. Finally, inspect tires for adequate tread and proper inflation.

Before shipping any cargo, you attempt to minimize potential damages by vetting your carriers right? Well, before your cargo is ever moved, make sure your carriers’ equipment is in good condition.

Driver State

Another serious risk factor to look for during pickups and deliveries is the physical and mental state of the driver that will be responsible for transporting your cargo. Drivers will spend a lot of time with your cargo, so it is in a shipper’s best interest to ensure their driver will be safe. Obviously, check that your driver is not under the influence of any drugs or alcohol. Just as important, make sure they aren’t groggy or tired, which can be just as dangerous as having alcohol in your system. Also, does your carrier help ensure driver compliance by maintaining organized and up to date logbooks? Do they have a detailed understanding of their drivers’ hours of service, and work to avoid violations? If not, your carrier and their drivers could be putting your entire business at risk.

If you ever have any doubts about the state of a driver, don’t be afraid to speak up. Checking the mental and physical state of the driver transporting your cargo is a crucial way to protect your business from supplier risk.

Personal Protective Equipment

During pickups and deliveries, make sure your carriers’ employees are using the proper personal protective equipment for the given job. OSHA requires, “protective equipment to be provided, used, and maintained in a sanitary and reliable condition wherever it is necessary.” This includes safety glasses, respirators, steel-toed boots, work shirts, gloves, hard hats, and hearing protection. Unfortunately, workplace accidents do happen, but using the proper equipment goes a long way to minimize these accidents and protect workers.

If your carrier provides personal protective equipment and mandates its proper use, this is a great sign you are working with a reliable and safe carrier. However, if you repeatedly see carriers engaging in risky behaviors during pickups and deliveries by not using proper safety equipment, you may want to consider a different carrier for your transportation needs.

Securement

Properly securing your cargo is one of the most important steps for minimizing damage. Therefore, you need to make sure your carriers’ securement equipment and practices won’t put your cargo at risk. First, check all securement equipment for damage and the effects of aging. This means inspecting chains for rust, tarps for holes, and straps for tears. Also, ensure your carriers are using the proper equipment for the type of trailer. Flat decks need corner protectors, and blocking and bracing should be used if loading a van. Finally, ensure your carrier tightens down all cargo before the truck moves anywhere.

Making sure your cargo is properly secured during pickups and deliveries dramatically lowers the chances of an accident involving your cargo. By checking your carriers’ securement practices, you can spot risky behaviors during pickups and deliveries.

Overall, we’ve covered three areas where you can identify carrier risk communication, on-site evaluations, and pickups and deliveries. By looking for risky behaviors during these interactions with your carriers, you can help protect your business from the consequences of supplier failure.

How Retailers Unleash the Disruptive Power of Data to Drive Customer Engagement

CONTRIBUTION BY ANTONIA RENNER – PRINCIPAL SOLUTIONS MARKETING MANAGER at INFORMATICA

Shop.org is the place to meet the top influencers and practitioners from the digital retail community.

Retailers and brands must transition from simply selling to customers to establishing relationships with them through personalized digital experiences driven by relevant content. Customers expect to be inspired, influenced, engaged and reassured that they have selected the right supplier and product. Customer experience defines a retailer’s success and this experience is the leading brand differentiator in a buying decision, leaving behind criteria such as product and price.

Readily available, rich product data helps to engage customers for a rich digital customer experience.

This can be challenging for retailers who have disparate product information across multiple systems and channels. In fact, merchants lag when it comes to cross-channel commerce: 51% of merchants cannot support mobile commerce, and 80% don’t integrate product information across web, mobile, applications and physical stores per 1WorldSync’s Charting Course for Global Commerce“. *

How Retailers Unleash the Disruptive Power of Data to Drive Customer Engagement

For consistent omnichannel management, retailers must consolidate complex product information, descriptions, and digital media assets from multiple systems and departments to fuel their different sales channels and marketing systems with consistent and high-quality information.

The next wave of leading brands and retailers understand the need to unleash the disruptive power of data to drive customer engagement. They use master-data fueled solutions as a single source of truth to stay ahead of the competition. Some best practices:

  • Fuel differentiated customer engagement with trusted, relevant and governed customer, product and supplier data.
  • Successfully publish consistent and high-quality product data for unified omnichannel experience.
  • Deliver high-quality service, personalized offers, and relevant cross-and-up-sell enhancing customer loyalty.
  • Access editable channel previews to better envision the customers’ shopping experience, ensuring consistent branding and leading to higher conversion rates.
  • Easily connect all key sales channels, e-commerce systems, e-procurement systems, e-marketplaces, catalogs, mobile devices or data synchronization.

Defining Industry Performance: Results of 2013 Depot Repair Benchmarking Survey

CONTRIBUTION BY MICHAEL R. BLUMBERG – CERTIFIED MANAGEMENT CONSULTANT (CMC) AND PRESIDENT & CEO OF BLUMBERG ADVISORY GROUP

The Depot Repair Industry encompasses a wide variety of enterprises, ranging from original equipment manufacturers to third party service providers and from single location companies to those with numerous shops across the US, Canada, and Mexico.  The types of products repaired include telecom, computers, servers, printers, and smart phones.

To better understand where this complex industry as a whole excels and where improvement might be warranted, Blumberg Advisory Group conducted a survey examining a number of key performance indicators (KPIs) in financial, production, and quality aspects of depot repair.

In the following pages, we discuss the results of this survey and address the key issues that affect many enterprises engaged in depot repair.  The analysis consisted of determining the industry average (median) and best in class (90th percentile) performance for a variety of financial, production, and quality key performance indicators.  In addition, similarities and differences were examined for the following demographic characteristics:

  • Company Size (as measured by number of facilities)
  • Company Business (OEM/ODM or Third Party)
  • Financial Structure (Cost Center, Profit Center, Revenue Center)
  • Average Cost per Repair (less than $250 or greater than $250)
  • Purchase of Enterprise Software in the past two years or not


Survey Results

The survey, conducted in August and September of 2013, included independent service organizations, original equipment manufacturers, third party repair firms, electronic manufacturing service providers, and distributors.
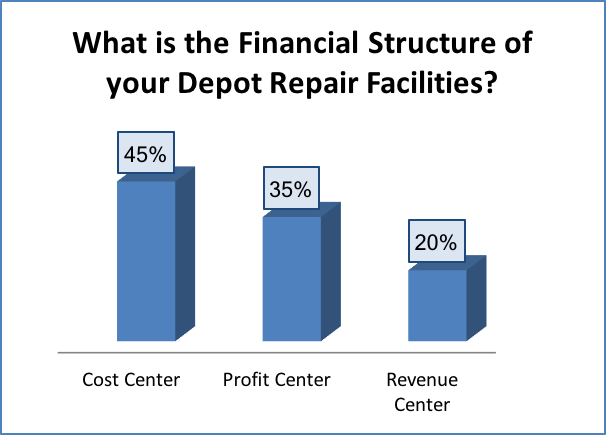
Figure 1

The results indicate that companies are split in how they account for their depot repair financially.  Based on the 2013 benchmark survey results, 45% of respondents view their depot repair as a cost center, 35% as a profit center, and 20% as a revenue or contribution center (Figure 1).

In terms of the types of equipment that depot repair companies support, the most common type of equipment supported was IT (55.9%) followed by “Other” (44.1%).  The “Other” category included equipment such as controllers, automotive diagnostic tools, industrial products, and guitars.  Equipment types that were less commonly supported included printers/scanners/faxes (20.6%) as well as consumer electronics such as MP3s, televisions, and digital cameras (17.6%).  See Figure 2 for the complete list of equipment types that are supported by the depot repair companies that participated in the benchmarking survey.

Figure 2

Financial Performance KPIs

As part of this survey we evaluated KPIs associated with a Depot Repair organization’s financial performance.  The KPIs were used to examine inventory turnover, costs of service, and overhead costs (Table 1).

Interestingly, industry average and BIC for all KPI questions related to overhead and materials costs tended to be quite similar between different types of depot repair companies.  The range value for BIC was always the best (lowest) one, and even the values for industry average tended to be on the better (lower) end of the range spectrum.  These findings indicate that depot repair companies tend to keep their overhead and materials costs low (as a % of their total revenue), regardless of their specific company characteristics.


Table 1:   Financial Performance KPIs

KPI Definition 2013 Benchmark
Industry Avg. BIC
Inventory Turnover Annual cost of goods sold / Inventory value 4.4 8
Direct Depot Repair Labor Costs as a % of Total Depot Repair Revenue (%) Direct Labor Costs / Total Depot Repair Revenue 16.01 to 19 Less than 10
In-Direct Depot Repair Labor Costs as a % of Total Depot Repair Revenue (%) In-Direct Labor Costs / Total Depot Repair Revenue Less than 18 Less than 18
IT Support Costs as a % of Total Depot Repair Revenue (%) IT Support Costs / Total Depot Repair Revenue Less than 10 Less than 10
Materials Costs as a % of Total Depot Repair Revenue (%) Materials Costs / Total Depot Repair Revenue 18.01 to 22 Less than 18
Engineering and Quality Support Costs as a % of Total Depot Repair Revenue (%) Engineering and Quality Support Costs / Total Depot Repair Revenue Less than 5 Less than 5


While overhead and materials costs tended to be similar between depot repair companies, direct depot repair labor costs (as a % of total revenue) often differed dramatically between different types of companies.  For example, when examining the financial structure of a depot repair company, the direct depot repair labor costs were much lower for revenue centers (industry average less than 10%) and cost centers (10% to 13%) compared to profit centers (more than 19%).  There was also a sharp contrast between companies who identified themselves as OEM/ODM, where depot repair labor costs (between 10% to 13%) while companies who identified themselves as third party repair firms had direct labor costs of more than 19%.  Just as with overhead and materials costs, however, the BIC for direct depot repair labor costs was always less than 10%, regardless of company characteristics.

Inventory turnover was also often dependent on specific company characteristics.  Companies that charged less than $250 on average per repair had a much higher turnover (industry average of 5.9 and BIC of 8) than companies that charged more than $250 on average per repair (3 and 4.6).  A depot repair company’s financial structure was also a factor, with cost centers having a much higher turnover (5.9 and 7.6) than profit centers (2 and 6.2) and revenue centers (4 and 4.8).  Finally, companies who manufacture their own equipment had a higher turnover (3.8 and 6.8) than third party companies (2 and 6.2).

Production and Quality Performance KPIs

The KPIs used to examine the efficiency and service quality of depot repair companies are identified in Table 2.

Table 2:   Production and Quality Performance KPIs

KPI Definition 2013 Benchmark
Industry Avg. BIC
Avg. # of units repaired per week per bench tech Total # of units repaired by bench techs per 5 day week / Total # of bench techs performing repairs per 5 day week 25 59
Avg. Repair Yield (%) Total # of units repaired / Total # of units processed 90 98
Avg. NFF Rate (%) Total # of units where reported mode of failure could not be verified / Total # of units processed 15 4.4
Avg. Repair Time per Unit (minutes) Total time worked during 5 day work week / Total # of units repaired during 5 day work week 60 13
Avg. Turnaround Time (days) Avg. total time from receipt to available in finished goods inventory 10 2
Avg. DOA Rate (%) Total # of units that were incapable of being repaired / Total # of units processed 2.8 0.6


In the depot repair industry, large enterprises have the reputation for being highly efficient and lower cost operations, while small companies have the reputation for being skilled craftsmen.  The analysis of the survey data showed that those advantages were in fact differences between large and small enterprises (as measured by the number of depot repair facilities) and that there are tradeoffs associated with those assets.

As seen in Figure 3, companies with 5 or more repair facilities had significantly more units repaired per week by each bench technician.  This result is supported by how much faster bench technicians repair each unit in large companies.  Since direct labor costs are a major component in the costs of service, faster repair time is a decided advantage for larger companies.


Figure 3


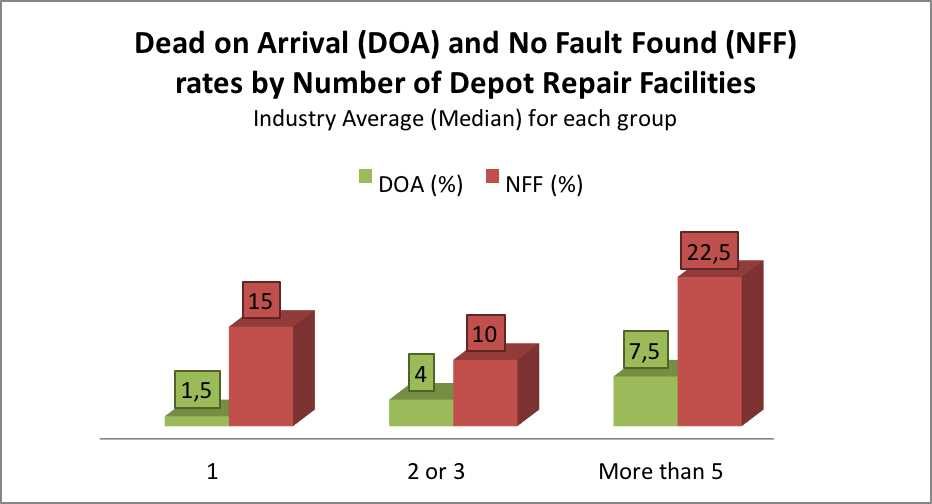
Small and medium sized companies, however, have advantages in lower Dead on Arrival (DOA) and No Fault Found (NFF) rates than larger companies (Figure 4).  The advantage of having lower DOA and NFF rates can be seen in the average repair yield, which is much higher for small (92%) and medium (92.5%) enterprises relative to their larger counterparts (85%).  This is likely a result of the fact that when bench technicians spend more time examining a unit under repair, they are more likely to detect the actual causes of equipment failures, resulting in a higher likelihood of repairing the equipment.

Figure 4


Companies who have recently purchased enterprise software (within the past 24 months) may be disappointed to see that while their DOA rate is lower, they have slower repair times and lower repair yield.  Since research shows that it takes 51% of companies 1 to 2+ years to fully implement their enterprise software program and another 35% of companies 6-12 months (The Real Impact of ERP Systems in the Public Sector, June 2012 by Microsoft Dynamics), it is not surprising that the full benefit has yet to be seen.  If this survey is repeated in 2015, the benefits of enterprise software are expected to be more evident.


Table 3:   Production and Quality Performance KPIs by Enterprise Software

KPI Enterprise Software
Industry Average (Median) Best in Class (90th Percentile)
Did Purchase Did Not Purchase Did Purchase Did Not Purchase
Avg. # of units repaired per week per bench tech 25 23 136 52.4
Avg. DOA Rate (%) 2.5 4 0.2 1
Avg. Repair Yield (%) 85 95 96.2 98
Avg. Repair Time per Unit (minutes) 90 52.5 25.8 9.5


Conclusions

The depot repair industry should be rightfully proud to see that overhead and materials costs are relatively low (as a % of total revenue).  Further, the best in class performance is consistently in the lowest (best) category for all financial KPIs (regardless of company characteristics), so the cream of the industry is comprised of all types of companies:  large and small, OEM/ODM and third party, etc.

Smaller companies tend to be skilled craftsmen, as is evident by great repair yield and low DOA and NFF rates.  The tradeoff is that their repair times tend to be slower.  Conversely, larger companies tend to be highly efficient with lower costs of service.  The tradeoff for this advantage is higher DOA and NFF rates, and therefore a lower repair yield.

While the long term benefits from implementation of enterprise software were not evident in these results, the external data supporting implementation is very compelling and future benchmarking surveys are expected to show that to be true for the depot repair industry as well.

Conducting these types of benchmarking studies is useful and continuing to assess industry performance every two or three years would be appropriate.

How To Spot Supplier Risk During On-Site Evaluations

CONTRIBUTION BY Ben Goldwasser – Business development professional

In our last post, we discussed how to spot risky behavior when communicating with suppliers. The second article in our series on identifying supplier risk explores what to look for during on-site evaluations. Specifically, in the transportation and logistics industry it can be very beneficial to visit your carriers in person. While on-site evaluations aren’t required, visiting your carriers can help you build better relationships and improve communication. Furthermore, visiting your carriers on-site allows you to evaluate them for risky behaviors that could potentially affect your company.

Here are some things to look for the next time you visit a carrier on-site:

Training Capabilities

When you originally vet your carriers, you make sure they are qualified to do the job at hand, right? A part of this vetting process includes ensuring your carrier’s employees are proficient. Therefore, when you arrive on-site, it is definitely important to check out your carrier’s training capabilities. Top carriers will have dedicated classroom space, a well thought-out training course, and experienced instructors. When you’re on-site, simply ask to review their training course to get an idea of how well it is preparing your carrier’s employees to work with your company. Does the training cover how to properly perform pre-trip inspections, how to properly secure cargo, or what to do in the case of emergency? According to a  2011 Commercial Vehicle Safety Alliance study, the most prominent securement violations are “failure to prevent shifting cargo, and “leaking/spilling/blowing/falling cargo.” Ensuring that drivers are properly trained to handle securement and deal with emergencies is critical to your business

If your carrier can not answer simple questions about their training program or it seems their course lacks substance, you may need to ask yourself if that carrier is the best fit for your company. Overall, your carriers represent less risk to your business the better their employees are trained.

Properly Stored & Inspected Equipment

Another crucial risk factor to look for during on-site evaluations is how your carriers store their equipment, spare parts and securement tools. The way that a carrier stores excess equipment can tell you a lot about their attention to detail and the value that they place on having their over the road equipment be in excellent condition.

While on-site, have a look at their inspection areas. Inspection areas should be well-lighted, and have spare chains and straps to replace defective securement.  It’s important that your carriers are taking all measures to minimize violations and damage during hauls.

In addition to securing cargo, also evaluate how well your carrier’s equipment is being maintained. Are tractors and trailers assessed for potential damage, parked in an organized and safe location, and repair areas kept clean? How promptly are mechanical issues taken care of? Are spare parts well organized and in safe locations for the mechanics to access them? Carriers that do not properly maintain their equipment can put your company at serious risk.

If your carrier fails to secure cargo, or neglects their fleet, their number of breakdowns and violations will soar; directly impacting your business.

Visual Inspections of Equipment

In addition to how your carrier stores their equipment, do they keep their fleet up to date and safe? When performing an on-site evaluation, take an opportunity to perform your own assessment of your carrier’s equipment for physical damage.  Identify things that could lead to supplier error, and thus, put your business at risk. Check tires for adequate tread and proper inflation. Inspect trailers for any internal or external damages. Also make sure securement equipment is functioning properly. Evaluate cabs to ensure they are safe for the driver and free of excessive distractions.

Ensuring your carrier properly maintains their fleet can help to dramatically reduce the potential for errors. Therefore, it is crucial while on-site to inspect your carrier’s equipment, and in turn, protect your business.

Proper Compliance

A final way to minimize risk when performing an on-site evaluation of your carrier is by inspecting how they handle compliance. Does your carrier maintain organized and up to date logbooks? Do they have a detailed understanding of their drivers’ hours of service, and work to avoid violations? Also, have they had any recent drug or alcohol violations? Or even worse, are there any drugs or alcohol on-site?

By evaluating your carriers for compliance issues, you are communicating your company’s values. You also can spot risky behaviors before they dramatically impact your company.

Overall, on-site evaluations allow you to get a closer look at your carriers day-to-day practices, and determine if they are the best fit for your company. If your carriers do not have an effective training program, properly store or maintain their equipment, or follow proper compliance protocol, it may be time to look elsewhere for your transportation and logistics needs.